About Me Video
QR Codes

|
The first image is a QR code of my name and weebly website made on http://qrcode.kaywa.com. The second image is a QR code of my name and weebly website made on http://www.qurify.com.
QR stands for Quick Response Codes. They are 2 dimensional barcodes that can be easily scanned using any modern mobile phone. QR codes allow teachers to extend learning beyond the school walls. They promote social sharing. Educational purposes for how to use QR codes in my math classroom include the following:
http://www.qurify.com/en/information_about_qr_codes/ https://docs.google.com/present/edit?id=0AclS3lrlFkCIZGhuMnZjdjVfNzY1aHNkdzV4Y3I http://www.youtube.com/watch?v=ayW032sKtj8 ---Ideas from McGuffey School District in Claysville, USA. |
MindMap
|
|
Applying percent concepts, such as with sales tax and tips was one concept that students struggled with in the 2011-2012 school year. I do not feel like I provided them with enough real world examples to help them really understand the concept. Therefore, I created a visual presentation which includes videos and practice problems which will help students visualize the concepts and understand how to apply percent concepts.
The Mindomo presentation could be done as a whole class, but my intent is to use it with small groups or partners in the classroom using NetBooks or in the computer lab. I feel like the presentation will empower students to be hands-on in the learning process. I want my students to be able to self-assess their own level or learning, and I feel like this presentation will allow them to do so. It supports all level of learners. Students can work at their own pace. Students are allowed to work with partners during this presentation, and I would also be available if students needed one-on-one assistance. The modifications that I have been asked to make in the past were to allow additional time, provide calculators, and provide one-on-one assistance. This presentation will meet all of those requirements. I created a three step process. The first two steps provide students with videos to learn about the concepts and problems to practice to make sure they understand. The last step allows students to assess their own level of learning. Based on this assessment, students can choose to continue to practice their skills by clicking on a link that would lead them to an interactive game. I enjoyed using Mindomo because I feel like it is very visually appealing. It allows the user to select from several different formats, layouts, backgrounds, lines, font, and colors. I like how you can add notes to the presentation. It was very easy to embed videos and pictures throughout the presentation. I also love the way that it keeps concepts organized. I feel like it would be easy for students to work through this presentation. I also believe that students could create their own Mindomo maps to explain math concepts and what they have learned. The following site help me to use Mindomo: http://www.youtube.com/watch?v=nyiISHl1Ua8 |
Presentation Tools
|
|
Public Link:
http://portal.sliderocket.com/BXPKP/2AD06E1A-D25D-4C57-B93E-D756E93DEFC8 When creating this project I thought about concepts that students struggled most with in the 2011-2012 school year. Setting up and solving proportions was one concept. I think the main reason was because they did not truly understand the basics of ratios and proportions. Therefore, I created a visual presentation which includes videos and games which will help students visualize the concepts and understand the basics of ratios and proportions. The SlideRocket presentation could be done as a whole class, but my intent is to use it with small groups or partners in the classroom using NetBooks or in the computer lab. I feel like the presentation will empower students to be hands-on in the learning process. I want my students to be able to self-assess their own level or learning, and I feel like this presentation will allow them to do so. It supports all level of learners. Students can work at their own pace. Students are allowed to work with partners during this presentation, and I would also be available if students needed one-on-one assistance. The modifications that I have been asked to make in the past were to allow additional time, provide calculators, and provide one-on-one assistance. This presentation will meet all of those requirements. The presentation has several YouTube videos, including one that is a song about proportions that I think students will be singing to themselves all day long. The other YouTube videos explain specific concepts about ratios and proportions. They provide real world examples and visuals that will assist with students understanding the concepts. They are also allowed to choose between two different YouTube videos, which one most appeals to them. I provided a site where they can access practice problems and work with a partner. Then I provide websites where they can check to see if they have mastered the concepts. These sites also provide students with information to assist them in understanding concepts if they miss a problem. At the end I provide students with two different interactive sites where they can access ratio and probability games, as well as another YouTube video. I provided these as an additional source where students can go to refine their skills. I enjoyed using sliderocket because it was very easy to embed videos and to link websites. It creates a presentation that is very visually appealing. It was very similar to the features of PowerPoint, so it was very easy to use. The following sites help me to use SlideRocket: http://cdn.sliderocket.com/GuidedTour/Tour.html http://www.youtube.com/watch?v=t2WetbfgEIg |
Google Tools
|
|
There are many Google apps. You can access them easily from the following website: http://www.schrockguide.net/bloomin-apps.html. The apps that I have found to be the most useful in my math classes are:
|
Google Maps
|
View Cost of Traveling - End of Year Field Trips in a larger map |
I created a Google Map for two educational purposes.
First to meet the following standards: 7.RP.2 Recognize and represent proportional relationships between quantities. 7.NS. Apply and extend previous understandings of operations with fractions to add, subtract, multiply, and divide rational numbers. Second to serve as a motivator for students to work toward the end of the year silver and gold card trips. In order to earn these trips students have to have a high GPA. I provided videos of the trips, in hopes of getting students excited about earning these end of the year trips. I learned how to created google maps with the help of the following websites: http://edte.ch/blog/maths-maps/ http://www.youtube.com/watch?v=TftFnot5uXw |
Google Earth

Ski Resort in Brighton Solitude, Utah.
Please click on the following link to access the entire lesson.
http://www.gelessons.com/lessons/studentcontrol/k12math/xtremetriangles/index2.html
This lesson makes the Pythagorean Theorem real world and fun for students. The objective of the lesson is to find the most X-Treme Ski Run. It has several placemarks available for students to open in Google Earth. Students can visually inspect the runs. They research beginning and ending elevations for each run. Then they use the Pythagorean Theorem to find the base of the run.
I think that Google Earth and Google maps are great for promoting knowledge and creativity. They take learning outside the walls of a classroom. For example, in this Google Earth lessons they get to travel the earth and find elevations of different ski resorts, while learning about the Pythagorean Theorem. The site where this lesson was located gives students step by step directions and tutorials to lead them to discovering new math mathematical concepts in a new and exciting way. I got a feeling of adventure as I was navigating though this lesson. It was way more fun than sitting in a classroom practicing ten problems on a whiteboard. It is very visually appealing, which is a key factor in getting students excited about a lesson. It supports all level of learners. Students can work at their own pace. I would allow students to work with partners for this project, and I would also be available if students needed one-on-one assistance.
Comic Life 2
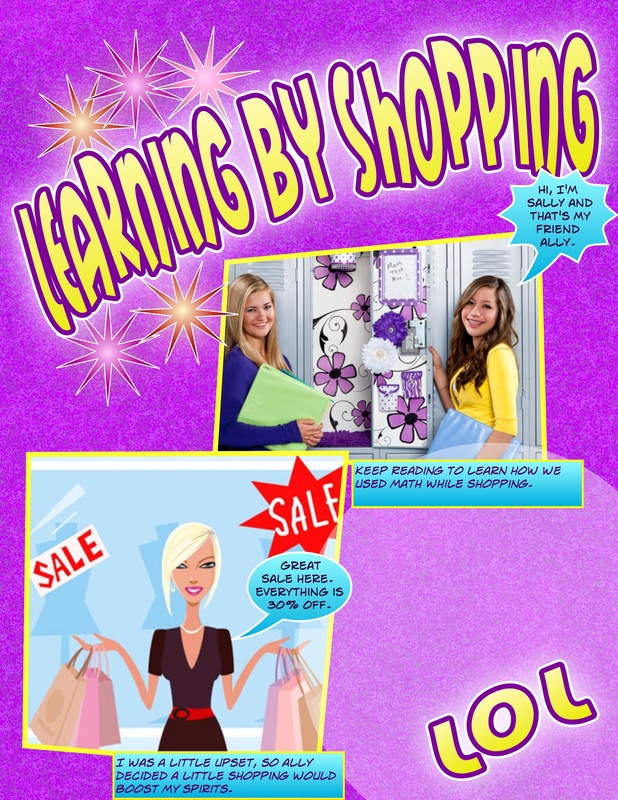
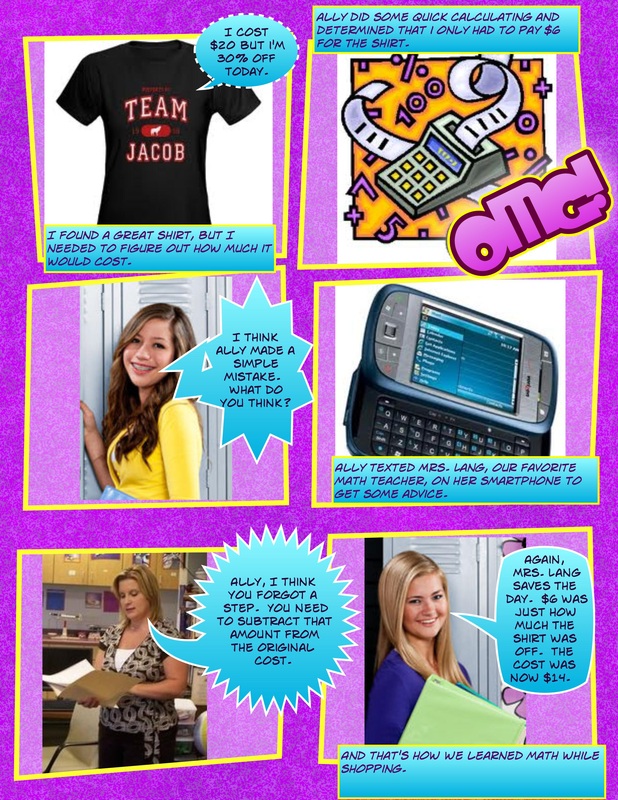
I created the comic below because students tend to make mistakes when calculating the final cost of an item. They remember how to get the % off, but then forget the final step. I hope that this comic will help them remember.
Web 2.0 Tools - Glogster EDU
|
|
20 of my favorite Web 2.0 tools can be found here:
https://docs.google.com/spreadsheet/ccc?key=0Au_CgbnDpN6bdFZ6VWt4 czRuMEVEQld3N0NoNFlzbWc#gid=0 I have embed a sample of one of the tools called a glog. I created it as an introduction to what students can expect to learn in seventh grade math. I think students would enjoy creating glogs as a way to exhibit what they are learning in class. |
|
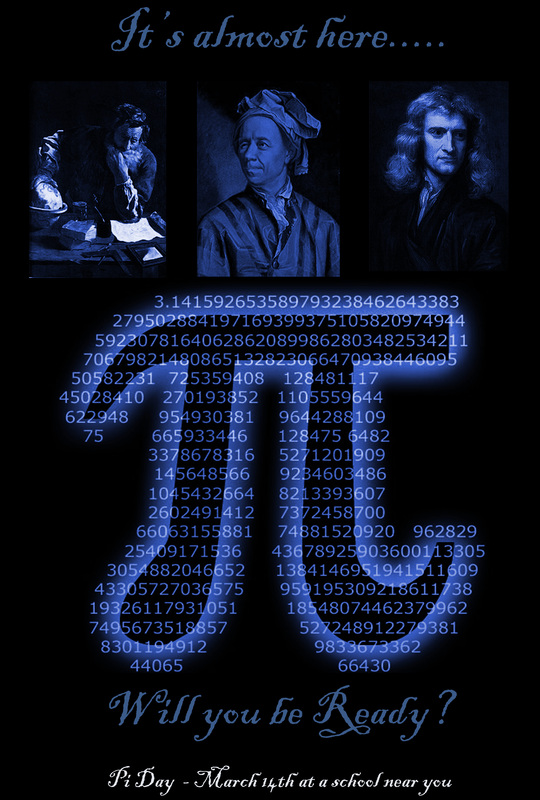
I plan on showing this movie poster to my students to get them ready for Pi Day. One of the activities they get to choose from is making a poster about Pi Day. I also plan on asking students to research who the mathematicians are on this poster and why they are relative to Pi Day. The following article at wikipedia will provide them the answers. http://en.wikipedia.org/wiki/Pi I watched these YouTube videos to learn more about making a movie poster with PhotoShop. I learned how to adjust canvas size, adjust hues, change opacity, crop, add text, etc. http://www.youtube.com/watch?v=C5_Me68ickk http://www.youtube.com/watch?v=YnFFvRx7GR4 http://www.youtube.com/watch?v=yuSI8ncGFIk&feature=related *** I chose not to get rid of the backgrounds on the pictures because I think it provides a relevant feature of the time period that the mathematicians are from. |
Pi Day Facebook Activity
|
I created this YouTube video on Windows Live Movie Maker. I will use it the first day of school to help students feel better about seventh grade and being part of a class/team. I will probably replay it several times throughout the year.
***Note to self: Add all videos, make edits, add music, and all photos FIRST. It will make edits a lot easier. |
| facebook_for_pi_day.pptx |
Teacher Tube Video
http://www.teachertube.com/viewVideo.php?video_id=448
